 |
Exploratory Pattern Analytics:
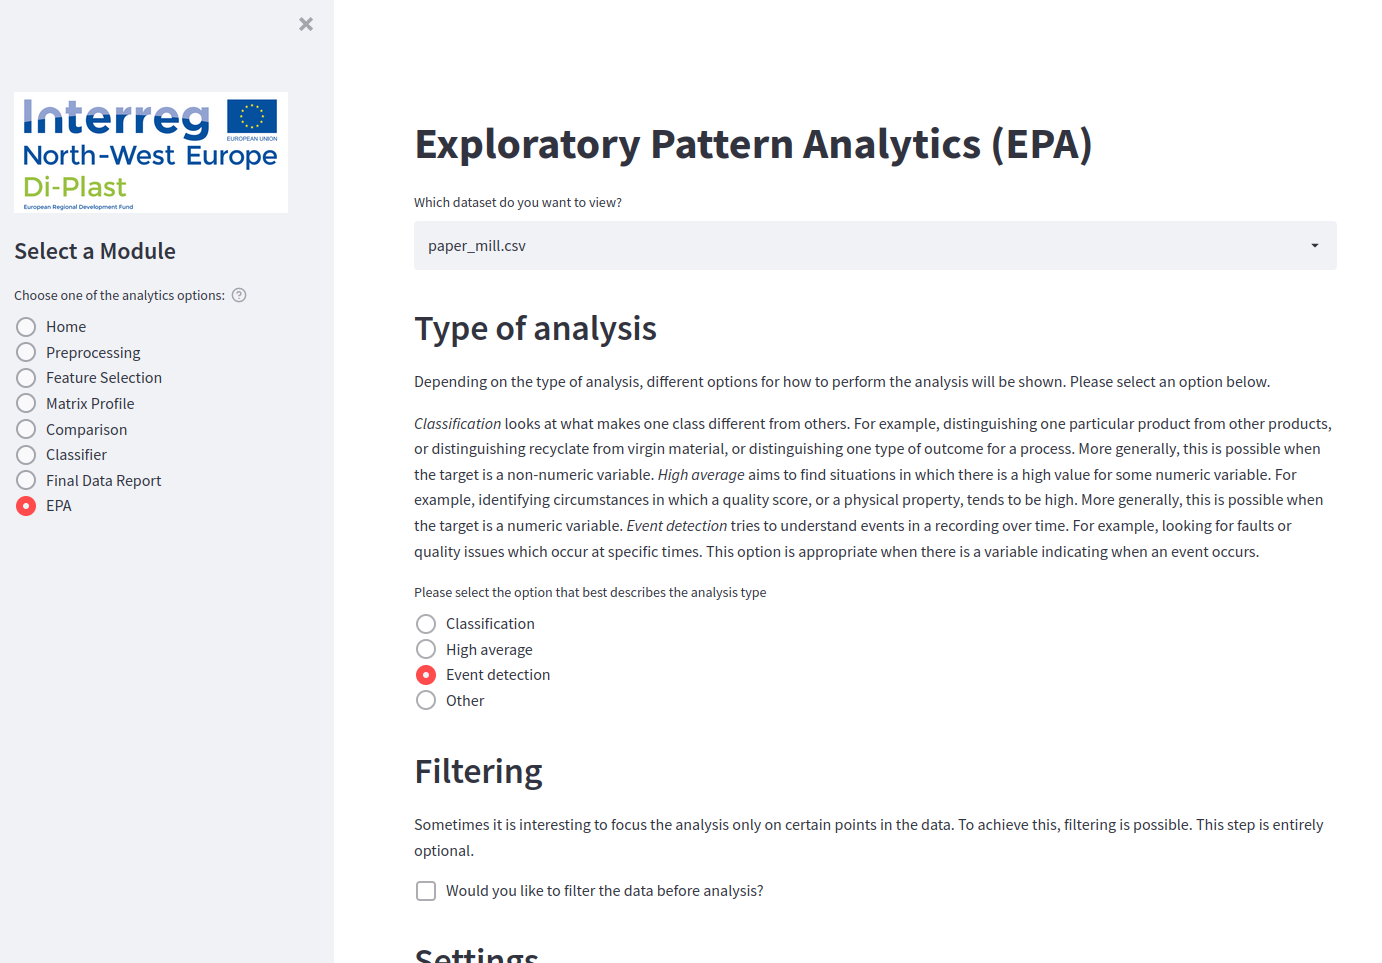
An important step in data analysis is data exploration, to achieve a better understanding of the data. The Exploratory Pattern Analytics (EPA) tool works on prepared/preprocessed tabular data. It provides explanatory patterns, i.e., simple rules between some parameters (e.g., temperature, pressure) that are predictive for a certain target parameter (e.g., scrap rate). This provides important insights enhancing data understanding.For example, it could be used to better understand why certain known outliers occur in process data.
Type of tool: Local browser-based app
Short description of the tool:
The tool is meant to guide users into starting with using Data Analytics at their organization.
Required skills:
- Process/material knowledge: Knowledge of the data being analysed
- Digitalization knowledge: (Basic) knowledge of how to filter/preprocess data for analysis
Required programs (step-by-step guide and links provided in user guideline blow):
- Python
- Java
- Anaconda
- Tool files from the GitHub (link below)
Disclaimer: (Disclaimer Text)
This tool supports you to:
- Visualize process data
- Compare two production runs (one with virgin material and one with recyclate)
- Explore patterns inside a dataset
Example use case:
After validating your data with help of e.g., the data validation tool, we can begin analyzing to get further insights. The Data Analytics tool is an interactive dashboard that helps with interpreting the variables in your dataset with help of visuals. By providing your own data in the 'data' folder, several analytical options are at your disposal. For example, a correlation plot that gives insights into which variables are behaving similarly, or a PCA analysis that will help determining the most influential variables in your dataset.
Tool guideline and access:
- ⚠️ We recommend to open and save the user guideline before proceeding: guidelines
- The tool is available through the Data Analytics tool interface at: https://github.com/cslab-hub/Data_Analytics_DIPLAST/tree/epa . Installation instructions are included in the file named "Installation.docx". The python interface for programmers is available at: https://github.com/cslab-hub/sd4py.
Contact person of the tool:
Dan Hudson mailto:daniel.dominic.hudson@uni-osnabrueck.de the University fo Osnabrück.
Related tools:
Before applying this tool:
We recommend also taking a look at the following Di-Plast tools below. They can help you to gather necessary information and data, help to better prepare your data and continue working with it afterwards:
--> Improve internal information and material flow -> VSM
--> Get guidance to set up a working data infrastructure -> Data Infrastructure Wiki
--> Find the right sensor to survey your process -> Sensor Tool
--> Validate your process data -> Data Validation
After applying this tool:
-->Analyse and Visualize your process data with data analytics -> Data Analytics
-->Match material requirements with material properties -> Matrix